 iOS
iOS Android
 Windows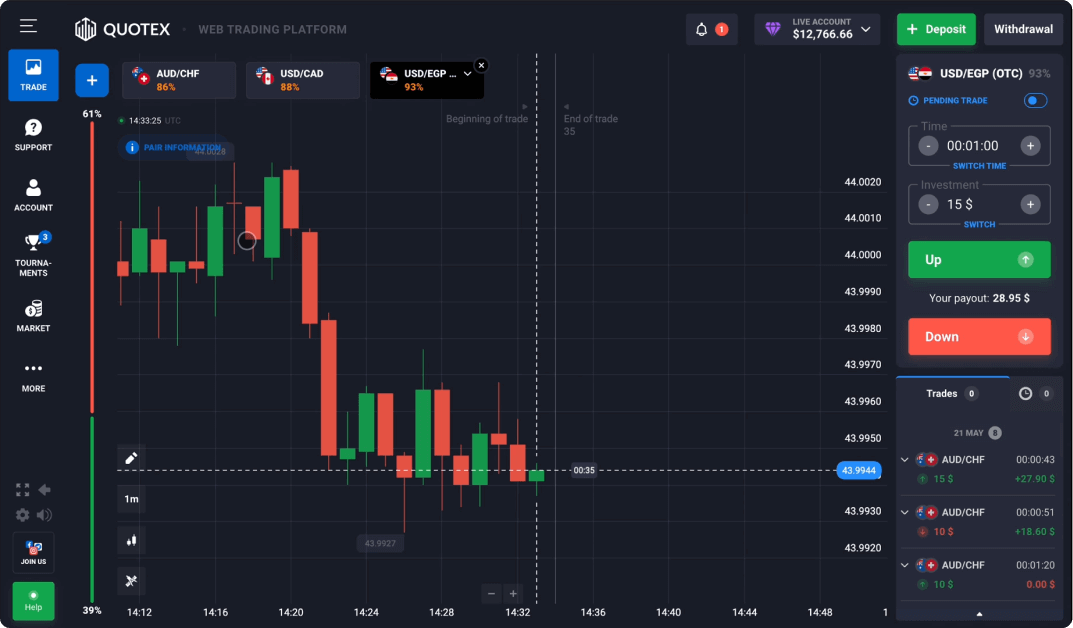
Reading charts and timing
A candle summarises opening, closing, high and low prices over an interval. That chart interval is separate from a contract’s expiry. Compare the labels and selected market before drawing conclusions; an attractive pattern alone is not a forecast.
What indicators can and cannot show
Indicators transform price observations into another view of the same data. Changing their settings changes the output. Agreement between several indicators is not independent proof of a future move; record assumptions and recognise uncertainty when examining a chart.
Understanding market labels
Currency pairs, commodities and cryptocurrency labels describe different reference markets. A trading contract does not necessarily grant ownership of the asset shown. Check the instrument’s definition, settlement rules and trading schedule before interpreting a quoted price.
Using the demo account
Demo mode records simulated activity using virtual funds. Confirm the selected account mode before interacting. A virtual balance cannot be withdrawn, and a favourable demo result does not establish what would happen with real money.
Understand the financial risk
Short-term financial contracts can cause loss of the amount committed. Repeated losses can accumulate quickly, and increasing exposure to recover losses can worsen them. Educational material, an attractive interface and past performance do not remove uncertainty.
Common questions
Does this guide recommend opening or funding an account?
No. It explains terminology and checks to make. Registration, eligibility and any decision involving real money are separate matters; demo results do not establish suitability.